What does the graph of the sinx function look like? Math lesson. Topic: "Function y=sin x, its properties and graph." Domain of definition and values, extrema, increase, decrease
In this lesson we will take a detailed look at the function y = sin x, its basic properties and graph. At the beginning of the lesson, we will give the definition of the trigonometric function y = sin t on the coordinate circle and consider the graph of the function on the circle and line. Let's show the periodicity of this function on the graph and consider the main properties of the function. At the end of the lesson, we will solve several simple problems using the graph of a function and its properties.
Topic: Trigonometric functions
Lesson: Function y=sinx, its basic properties and graph
When considering a function, it is important to associate each argument value with a single function value. This law of correspondence and is called a function.
Let us define the correspondence law for .
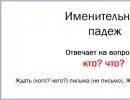
Any real number corresponds to a single point on the unit circle. A point has a single ordinate, which is called the sine of the number (Fig. 1).

![]()
Each argument value is associated with a single function value.
Obvious properties follow from the definition of sine.
The figure shows that ![]() because is the ordinate of a point on the unit circle.
because is the ordinate of a point on the unit circle.
Consider the graph of the function. Let us recall the geometric interpretation of the argument. The argument is the central angle, measured in radians. Along the axis we will plot real numbers or angles in radians, along the axis the corresponding function values.
For example, an angle on the unit circle corresponds to a point on the graph (Fig. 2)

We have obtained a graph of the function in the area. But knowing the period of the sine, we can depict the graph of the function over the entire domain of definition (Fig. 3).

The main period of the function is This means that the graph can be obtained on a segment and then continued throughout the entire domain of definition.
Consider the properties of the function:
1) Scope of definition:
2) Range of values: ![]()
3) Odd function:
4) Smallest positive period:
5) Coordinates of the points of intersection of the graph with the abscissa axis: ![]()
6) Coordinates of the point of intersection of the graph with the ordinate axis:
7) Intervals at which the function takes positive values:
8) Intervals at which the function takes negative values:
9) Increasing intervals:
10) Decreasing intervals:
11) Minimum points: ![]()
12) Minimum functions:
13) Maximum points: ![]()
14) Maximum functions:
We looked at the properties of the function and its graph. The properties will be used repeatedly when solving problems.
Bibliography
1. Algebra and beginning of analysis, grade 10 (in two parts). Tutorial for educational institutions (profile level) ed. A. G. Mordkovich. -M.: Mnemosyne, 2009.
2. Algebra and beginning of analysis, grade 10 (in two parts). Problem book for educational institutions (profile level), ed. A. G. Mordkovich. -M.: Mnemosyne, 2007.
3. Vilenkin N.Ya., Ivashev-Musatov O.S., Shvartsburd S.I. Algebra and mathematical analysis for 10th grade ( tutorial for students of schools and classes with in-depth study of mathematics).-M.: Prosveshchenie, 1996.
4. Galitsky M.L., Moshkovich M.M., Shvartsburd S.I. In-depth study of algebra and mathematical analysis.-M.: Education, 1997.
5. Collection of problems in mathematics for applicants to higher educational institutions (edited by M.I. Skanavi). - M.: Higher School, 1992.
6. Merzlyak A.G., Polonsky V.B., Yakir M.S. Algebraic simulator.-K.: A.S.K., 1997.
7. Sahakyan S.M., Goldman A.M., Denisov D.V. Problems on algebra and principles of analysis (a manual for students in grades 10-11 of general education institutions). - M.: Prosveshchenie, 2003.
8. Karp A.P. Collection of problems on algebra and principles of analysis: textbook. allowance for 10-11 grades. with depth studied Mathematics.-M.: Education, 2006.
Homework
Algebra and beginning of analysis, grade 10 (in two parts). Problem book for educational institutions (profile level), ed.
A. G. Mordkovich. -M.: Mnemosyne, 2007.
№№ 16.4, 16.5, 16.8.
Additional web resources
3. Educational portal to prepare for exams ().
How to graph the function y=sin x? First, let's look at the sine graph on the interval.
We take a single segment 2 cells long in the notebook. On the Oy axis we mark one.
For convenience, we round the number π/2 to 1.5 (and not to 1.6, as required by the rounding rules). In this case, a segment of length π/2 corresponds to 3 cells.
On the Ox axis we mark not single segments, but segments of length π/2 (every 3 cells). Accordingly, a segment of length π corresponds to 6 cells, and a segment of length π/6 corresponds to 1 cell.
With this choice of a unit segment, the graph depicted on a sheet of notebook in a box corresponds as much as possible to the graph of the function y=sin x.
Let's make a table of sine values on the interval:
We mark the resulting points on the coordinate plane:

Since y=sin x is an odd function, the sine graph is symmetrical with respect to the origin - point O(0;0). Taking this fact into account, let’s continue plotting the graph to the left, then the points -π:

The function y=sin x is periodic with period T=2π. Therefore, the graph of a function taken on the interval [-π;π] is repeated an infinite number of times to the right and to the left.
Functiony = sinx
The graph of the function is a sinusoid.
The complete non-repeating portion of a sine wave is called a sine wave.
Half a sine wave is called a half sine wave (or arc).
Function propertiesy =
sinx:
3) This is an odd function. 4) This continuous function.
6) On the segment [-π/2; π/2] function increases on the interval [π/2; 3π/2] – decreases. 7) On intervals the function takes positive values. 8) Intervals of increasing function: [-π/2 + 2πn; π/2 + 2πn]. 9) Minimum points of the function: -π/2 + 2πn. |
To graph a function y= sin x It is convenient to use the following scales:
On a sheet of paper with a square, we take the length of two squares as a unit of segment.
On axis x Let's measure the length π. At the same time, for convenience, we present 3.14 in the form of 3 - that is, without a fraction. Then on a sheet of paper in a cell π will be 6 cells (three times 2 cells). And each cell will receive its own natural name (from the first to the sixth): π/6, π/3, π/2, 2π/3, 5π/6, π. These are the meanings x.
On the y-axis we mark 1, which includes two cells.
Let's create a table of function values using our values x:
√3 | √3 |
Next we will create a schedule. The result is a half-wave, the highest point of which is (π/2; 1). This is the graph of the function y= sin x on the segment. Let's add a symmetrical half-wave to the constructed graph (symmetrical relative to the origin, that is, on the segment -π). The crest of this half-wave is under the x-axis with coordinates (-1; -1). The result will be a wave. This is the graph of the function y= sin x on the segment [-π; π].
You can continue the wave by constructing it on the segment [π; 3π], [π; 5π], [π; 7π], etc. On all these segments, the graph of the function will look the same as on the segment [-π; π]. You will get a continuous wavy line with identical waves.
Functiony = cosx.
The graph of a function is a sine wave (sometimes called a cosine wave).

Function propertiesy = cosx:
1) The domain of definition of a function is the set of real numbers. 2) The range of function values is the segment [–1; 1] 3) This is an even function. 4) This is a continuous function. 5) Coordinates of the intersection points of the graph: 6) On the segment the function decreases, on the segment [π; 2π] – increases. 7) On intervals [-π/2 + 2πn; π/2 + 2πn] function takes positive values. 8) Increasing intervals: [-π + 2πn; 2πn]. 9) Minimum points of the function: π + 2πn. 10) The function is limited from above and below. Lowest value functions –1, 11) This is a periodic function with a period of 2π (T = 2π) |
Functiony = mf(x).
Let's take the previous function y=cos x. As you already know, its graph is a sine wave. If we multiply the cosine of this function by a certain number m, then the wave will expand from the axis x(or will shrink, depending on the value of m).
This new wave will be the graph of the function y = mf(x), where m is any real number.
Thus, the function y = mf(x) is the familiar function y = f(x) multiplied by m.
Ifm< 1, то синусоида сжимается к оси x by the coefficientm. Ifm > 1, then the sinusoid is stretched from the axisx by the coefficientm.
When performing stretching or compression, you can first plot only one half-wave of a sine wave, and then complete the entire graph.
Functiony= f(kx).
If the function y=mf(x) leads to stretching of the sinusoid from the axis x or compression towards the axis x, then the function y = f(kx) leads to stretching from the axis y or compression towards the axis y.
Moreover, k is any real number.
At 0< k< 1 синусоида растягивается от оси y by the coefficientk. Ifk > 1, then the sinusoid is compressed towards the axisy by the coefficientk.
When graphing this function, you can first build one half-wave of a sine wave, and then use it to complete the entire graph.
Functiony = tgx.
Function graph y= tg x is a tangent.
It is enough to construct part of the graph in the interval from 0 to π/2, and then you can symmetrically continue it in the interval from 0 to 3π/2.

Function propertiesy = tgx:
Functiony = ctgx
Function graph y=ctg x is also a tangentoid (it is sometimes called a cotangentoid).

Function propertiesy = ctgx:
>>Mathematics: Functions y = sin x, y = cos x, their properties and graphs
Functions y = sin x, y = cos x, their properties and graphs
In this section we will discuss some properties of the functions y = sin x,y= cos x and build their graphs.
1. Function y = sin X.
Above, in § 20, we formulated a rule that allows each number t to be associated with a cos t number, i.e. characterized the function y = sin t. Let us note some of its properties.
Properties of the function u = sin t.
The domain of definition is the set K of real numbers.
This follows from the fact that any number 2 corresponds to a point M(1) on the number circle, which has a well-defined ordinate; this ordinate is cos t.
u = sin t is an odd function.
This follows from the fact that, as was proven in § 19, for any t the equality
This means that the graph of the function u = sin t is like any graph odd function, is symmetrical with respect to the origin in the rectangular coordinate system tOi.
The function u = sin t increases on the interval 
This follows from the fact that when a point moves along the first quarter number circle the ordinate gradually increases (from 0 to 1 - see Fig. 115), and when the point moves along the second quarter of the numerical circle, the ordinate gradually decreases (from 1 to 0 - see Fig. 116).

The function u = sint is bounded both below and above. This follows from the fact that, as we saw in § 19, for any t the inequality holds
(the function reaches this value at any point of the form ![]() (the function reaches this value at any point of the form
(the function reaches this value at any point of the form
Using the obtained properties, we will construct a graph of the function of interest to us. But (attention!) instead of u - sin t we will write y = sin x (after all, we are more accustomed to writing y = f(x), and not u = f(t)). This means that we will build a graph in the usual xOy coordinate system (and not tOy).
Let's make a table of the values of the function y - sin x:

Comment.
Let us give one of the versions of the origin of the term “sine”. In Latin, sinus means bend (bow string).
The constructed graph to some extent justifies this terminology. 
The line that serves as a graph of the function y = sin x is called a sine wave. That part of the sinusoid that is shown in Fig. 118 or 119 is called a sine wave, and that part of the sine wave that is shown in Fig. 117, is called a half-wave or arc of a sine wave.
2. Function y = cos x.
The study of the function y = cos x could be carried out approximately according to the same scheme that was used above for the function y = sin x. But we will choose the path that leads to the goal faster. First, we will prove two formulas that are important in themselves (you will see this in high school), but for now have only auxiliary significance for our purposes.
For any value of t the following equalities are valid:

Proof. Let the number t correspond to point M of the numerical circle n, and the number * + - point P (Fig. 124; for the sake of simplicity, we took point M in the first quarter). The arcs AM and BP are equal, and the right triangles OKM and OLBP are correspondingly equal. This means O K = Ob, MK = Pb. From these equalities and from the location of triangles OCM and OBP in the coordinate system, we draw two conclusions:
1) the ordinate of point P both in magnitude and sign coincides with the abscissa of point M; it means that

2) the abscissa of point P is equal in absolute value to the ordinate of point M, but differs in sign from it; it means that
![]()
Approximately the same reasoning is carried out in cases where point M does not belong to the first quarter.
Let's use the formula  (this is the formula proven above, only instead of the variable t we use the variable x). What does this formula give us? It allows us to assert that the functions
![]() are identical, which means their graphs coincide.
are identical, which means their graphs coincide.
Let's plot the function  To do this, let's move on to an auxiliary coordinate system with the origin at a point (the dotted line is drawn in Fig. 125). Let's associate the function y = sin x to new system coordinates - this will be the graph of the function
 ![]() (Fig. 125), i.e. graph of the function y - cos x. It, like the graph of the function y = sin x, is called a sine wave (which is quite natural).
(Fig. 125), i.e. graph of the function y - cos x. It, like the graph of the function y = sin x, is called a sine wave (which is quite natural).
Properties of the function y = cos x.
![]()
y = cos x is an even function.

The construction stages are shown in Fig. 126:

1) build a graph of the function y = cos x (more precisely, one half-wave);
2) by stretching the constructed graph from the x-axis with a factor of 0.5, we obtain one half-wave of the required graph;
3) using the resulting half-wave, we construct the entire graph of the function y = 0.5 cos x.
"Yoshkar-Ola College of Service Technologies"
Construction and study of the graph of the trigonometric function y=sinx in a spreadsheetMS Excel
/methodological development/
Yoshkar – Ola
Subject. Construction and study of the graph of a trigonometric functiony = sinx in MS Excel spreadsheet
Lesson type– integrated (gaining new knowledge)
Goals:
Didactic purpose - explore the behavior of trigonometric function graphsy= sinxdepending on odds using a computer
Educational:
1. Find out the change in the graph of a trigonometric function y= sin x depending on odds
2. Show the introduction of computer technology in teaching mathematics, the integration of two subjects: algebra and computer science.
3. Develop skills in using computer technology in mathematics lessons
4. Strengthen the skills of studying functions and constructing their graphs
Educational:
1. To develop students’ cognitive interest in academic disciplines and the ability to apply their knowledge in practical situations
2. Develop the ability to analyze, compare, highlight the main thing
3. Help increase general level student development
Educating :
1. Foster independence, accuracy, and hard work
2. Foster a culture of dialogue
Forms of work in the lesson - combined
Didactic facilities and equipment:
1. Computers
2. Multimedia projector
4. Handouts
5. Presentation slides
During the classes
I. Organization of the beginning of the lesson
· Greeting students and guests
· Mood for the lesson
II. Goal setting and topic updating
It takes a lot of time to study a function and build its graph, you have to perform a lot of cumbersome calculations, it’s not convenient, computer technology comes to the rescue.
Today we will learn how to build graphs of trigonometric functions in the spreadsheet environment of MS Excel 2007.
The topic of our lesson is “Construction and study of the graph of a trigonometric function y= sinx in a table processor"
From the algebra course we know the scheme for studying a function and constructing its graph. Let's remember how to do this.
Slide 2
Function study scheme
1. Domain of the function (D(f))
2. Range of function E(f)
3. Determination of parity
4. Frequency
5. Zeros of the function (y=0)
6. Intervals of constant sign (y>0, y<0)
7. Periods of monotony
8. Extrema of the function
III. Primary assimilation of new educational material
Open MS Excel 2007.
Let's plot the function y=sin x
Building graphs in a spreadsheet processorMS Excel 2007
We will plot the graph of this function on the segment xЄ [-2π; 2π]
We will take the values of the argument in steps , to make the graph more accurate.
Since the editor works with numbers, let’s convert radians to numbers, knowing that P ≈ 3.14 . (translation table in handout).
1. Find the value of the function at the point x=-2P. For the rest, the editor calculates the corresponding function values automatically.
2. Now we have a table with the values of the argument and function. With this data, we have to plot this function using the Chart Wizard.
3. To build a graph, you need to select the required data range, lines with argument and function values
4..jpg" width="667" height="236 src=">
We write down the conclusions in a notebook (Slide 5)
Conclusion. The graph of a function of the form y=sinx+k is obtained from the graph of the function y=sinx using parallel translation along the axis of the op-amp by k units
If k >0, then the graph shifts up by k units
If k<0, то график смещается вниз на k единиц
Construction and study of a function of the formy=k*sinx,k- const
Task 2. At work Sheet2 draw graphs of functions in one coordinate system y= sinx y=2* sinx, y= * sinx, on the interval (-2π; 2π) and watch how the appearance of the graph changes.
(In order not to re-set the value of the argument, let's copy the existing values. Now you need to set the formula and build a graph using the resulting table.)
We compare the resulting graphs. Together with students, we analyze the behavior of the graph of a trigonometric function depending on the coefficients. (Slide 6)
https://pandia.ru/text/78/510/images/image005_66.gif" width="16" height="41 src=">x , on the interval (-2π; 2π) and watch how the appearance of the graph changes.
We compare the resulting graphs. Together with students, we analyze the behavior of the graph of a trigonometric function depending on the coefficients. (Slide 8)
https://pandia.ru/text/78/510/images/image008_35.jpg" width="649" height="281 src=">
We write down the conclusions in a notebook (Slide 11)
Conclusion. The graph of a function of the form y=sin(x+k) is obtained from the graph of the function y=sinx using parallel translation along the OX axis by k units
If k >1, then the graph shifts to the right along the OX axis
If 0 IV. Primary consolidation of acquired knowledge Differentiated cards with a task to construct and study a function using a graph Y=6*sin(x) Y=1-2
sinX Y=-
sin(3x+)
1.
Domain 2.
Range of value 3.
Parity 4.
Periodicity 5.
Intervals of sign constancy 6.
Gapsmonotony Function increases Function decreases 7.
Extrema of the function Minimum Maximum V. Homework organization Plot a graph of the function y=-2*sinх+1, examine and check the correctness of construction in a Microsoft Excel spreadsheet environment. (Slide 12) VI. Reflection