The geometric meaning of the derivative. Function derivative. The meaning of the derivative of a function How to find the largest value of the derivative at a point
In problem B9, a graph of a function or derivative is given, from which it is required to determine one of the following quantities:
- The value of the derivative at some point x 0,
- High or low points (extremum points),
- Intervals of increasing and decreasing functions (intervals of monotonicity).
The functions and derivatives presented in this problem are always continuous, which greatly simplifies the solution. Despite the fact that the task belongs to the section of mathematical analysis, it is quite within the power of even the weakest students, since no deep theoretical knowledge is required here.
To find the value of the derivative, extremum points and monotonicity intervals, there are simple and universal algorithms - all of them will be discussed below.
Carefully read the condition of problem B9 in order not to make stupid mistakes: sometimes quite voluminous texts come across, but there are few important conditions that affect the course of the solution.
Calculation of the value of the derivative. Two point method
If the problem is given a graph of the function f(x), tangent to this graph at some point x 0 , and it is required to find the value of the derivative at this point, the following algorithm is applied:
- Find two "adequate" points on the tangent graph: their coordinates must be integer. Let's denote these points as A (x 1 ; y 1) and B (x 2 ; y 2). Write down the coordinates correctly - this is the key point of the solution, and any mistake here leads to the wrong answer.
- Knowing the coordinates, it is easy to calculate the increment of the argument Δx = x 2 − x 1 and the increment of the function Δy = y 2 − y 1 .
- Finally, we find the value of the derivative D = Δy/Δx. In other words, you need to divide the function increment by the argument increment - and this will be the answer.
Once again, we note: points A and B must be sought precisely on the tangent, and not on the graph of the function f(x), as is often the case. The tangent will necessarily contain at least two such points, otherwise the problem is formulated incorrectly.
Consider the points A (−3; 2) and B (−1; 6) and find the increments:
Δx \u003d x 2 - x 1 \u003d -1 - (-3) \u003d 2; Δy \u003d y 2 - y 1 \u003d 6 - 2 \u003d 4.
Let's find the value of the derivative: D = Δy/Δx = 4/2 = 2.
A task. The figure shows the graph of the function y \u003d f (x) and the tangent to it at the point with the abscissa x 0. Find the value of the derivative of the function f(x) at the point x 0 .

Consider points A (0; 3) and B (3; 0), find increments:
Δx \u003d x 2 - x 1 \u003d 3 - 0 \u003d 3; Δy \u003d y 2 - y 1 \u003d 0 - 3 \u003d -3.
Now we find the value of the derivative: D = Δy/Δx = −3/3 = −1.
A task. The figure shows the graph of the function y \u003d f (x) and the tangent to it at the point with the abscissa x 0. Find the value of the derivative of the function f(x) at the point x 0 .

Consider points A (0; 2) and B (5; 2) and find increments:
Δx \u003d x 2 - x 1 \u003d 5 - 0 \u003d 5; Δy = y 2 - y 1 = 2 - 2 = 0.
It remains to find the value of the derivative: D = Δy/Δx = 0/5 = 0.
From the last example, we can formulate the rule: if the tangent is parallel to the OX axis, the derivative of the function at the point of contact is equal to zero. In this case, you don’t even need to calculate anything - just look at the graph.
Calculating High and Low Points
Sometimes instead of a graph of a function in problem B9, a derivative graph is given and it is required to find the maximum or minimum point of the function. In this scenario, the two-point method is useless, but there is another, even simpler algorithm. First, let's define the terminology:
- The point x 0 is called the maximum point of the function f(x) if the following inequality holds in some neighborhood of this point: f(x 0) ≥ f(x).
- The point x 0 is called the minimum point of the function f(x) if the following inequality holds in some neighborhood of this point: f(x 0) ≤ f(x).
In order to find the maximum and minimum points on the graph of the derivative, it is enough to perform the following steps:
- Redraw the graph of the derivative, removing all unnecessary information. As practice shows, extra data only interfere with the solution. Therefore, we mark the zeros of the derivative on the coordinate axis - and that's it.
- Find out the signs of the derivative on the intervals between zeros. If for some point x 0 it is known that f'(x 0) ≠ 0, then only two options are possible: f'(x 0) ≥ 0 or f'(x 0) ≤ 0. The sign of the derivative is easy to determine from the original drawing: if the derivative graph lies above the OX axis, then f'(x) ≥ 0. Conversely, if the derivative graph lies below the OX axis, then f'(x) ≤ 0.
- We again check the zeros and signs of the derivative. Where the sign changes from minus to plus, there is a minimum point. Conversely, if the sign of the derivative changes from plus to minus, this is the maximum point. Counting is always done from left to right.
This scheme works only for continuous functions - there are no others in problem B9.
A task. The figure shows a graph of the derivative of the function f(x) defined on the interval [−5; 5]. Find the minimum point of the function f(x) on this segment.

Let's get rid of unnecessary information - we will leave only the borders [−5; 5] and the zeros of the derivative x = −3 and x = 2.5. Also note the signs:
Obviously, at the point x = −3, the sign of the derivative changes from minus to plus. This is the minimum point.
A task. The figure shows a graph of the derivative of the function f(x) defined on the interval [−3; 7]. Find the maximum point of the function f(x) on this segment.

Let's redraw the graph, leaving only the boundaries [−3; 7] and the zeros of the derivative x = −1.7 and x = 5. Note the signs of the derivative on the resulting graph. We have:
![]()
Obviously, at the point x = 5, the sign of the derivative changes from plus to minus - this is the maximum point.
A task. The figure shows a graph of the derivative of the function f(x) defined on the interval [−6; four]. Find the number of maximum points of the function f(x) that belong to the interval [−4; 3].

It follows from the conditions of the problem that it is sufficient to consider only the part of the graph bounded by the segment [−4; 3]. Therefore, we build a new graph, on which we mark only the boundaries [−4; 3] and the zeros of the derivative inside it. Namely, the points x = −3.5 and x = 2. We get:
![]()
On this graph, there is only one maximum point x = 2. It is in it that the sign of the derivative changes from plus to minus.
A small note about points with non-integer coordinates. For example, in the last problem, the point x = −3.5 was considered, but with the same success we can take x = −3.4. If the problem is formulated correctly, such changes should not affect the answer, since the points "without a fixed place of residence" are not directly involved in solving the problem. Of course, with integer points such a trick will not work.
Finding intervals of increase and decrease of a function
In such a problem, like the points of maximum and minimum, it is proposed to find areas in which the function itself increases or decreases from the graph of the derivative. First, let's define what ascending and descending are:
- A function f(x) is called increasing on a segment if for any two points x 1 and x 2 from this segment the statement is true: x 1 ≤ x 2 ⇒ f(x 1) ≤ f(x 2). In other words, the larger the value of the argument, the larger the value of the function.
- A function f(x) is called decreasing on a segment if for any two points x 1 and x 2 from this segment the statement is true: x 1 ≤ x 2 ⇒ f(x 1) ≥ f(x 2). Those. a larger value of the argument corresponds to a smaller value of the function.
We formulate sufficient conditions for increasing and decreasing:
- For a continuous function f(x) to increase on the segment , it is sufficient that its derivative inside the segment be positive, i.e. f'(x) ≥ 0.
- For a continuous function f(x) to decrease on the segment , it is sufficient that its derivative inside the segment be negative, i.e. f'(x) ≤ 0.
We accept these assertions without proof. Thus, we obtain a scheme for finding intervals of increase and decrease, which is in many ways similar to the algorithm for calculating extremum points:
- Remove all redundant information. On the original graph of the derivative, we are primarily interested in the zeros of the function, so we leave only them.
- Mark the signs of the derivative at the intervals between zeros. Where f'(x) ≥ 0, the function increases, and where f'(x) ≤ 0, it decreases. If the problem has restrictions on the variable x, we additionally mark them on the new chart.
- Now that we know the behavior of the function and the constraint, it remains to calculate the required value in the problem.
A task. The figure shows a graph of the derivative of the function f(x) defined on the interval [−3; 7.5]. Find the intervals of decreasing function f(x). In your answer, write the sum of integers included in these intervals.

As usual, we redraw the graph and mark the boundaries [−3; 7.5], as well as the zeros of the derivative x = −1.5 and x = 5.3. Then we mark the signs of the derivative. We have:
![]()
Since the derivative is negative on the interval (− 1.5), this is the interval of decreasing function. It remains to sum all the integers that are inside this interval:
−1 + 0 + 1 + 2 + 3 + 4 + 5 = 14.
A task. The figure shows a graph of the derivative of the function f(x) defined on the segment [−10; four]. Find the intervals of increasing function f(x). In your answer, write the length of the largest of them.
Let's get rid of redundant information. We leave only the boundaries [−10; 4] and zeros of the derivative, which this time turned out to be four: x = −8, x = −6, x = −3 and x = 2. Note the signs of the derivative and get the following picture:
We are interested in the intervals of increasing function, i.e. where f'(x) ≥ 0. There are two such intervals on the graph: (−8; −6) and (−3; 2). Let's calculate their lengths:
l 1 = − 6 − (−8) = 2;
l 2 = 2 − (−3) = 5.
Since it is required to find the length of the largest of the intervals, we write the value l 2 = 5 in response.
Hello! Let's hit the approaching USE with high-quality systematic training, and perseverance in grinding the granite of science !!! ATAt the end of the post there is a competitive task, be the first! In one of the articles in this section, we are with you, in which the graph of the function was given, and various questions were raised regarding extrema, intervals of increase (decrease) and others.
In this article, we will consider the tasks included in the USE in mathematics, in which the graph of the derivative of a function is given, and the following questions are posed:
1. At what point of a given segment does the function take on the largest (or smallest) value.
2. Find the number of maximum (or minimum) points of the function that belong to a given segment.
3. Find the number of extremum points of the function that belong to a given segment.
4. Find the extremum point of the function that belongs to the given segment.
5. Find intervals of increase (or decrease) of the function and in the answer indicate the sum of integer points included in these intervals.
6. Find intervals of increase (or decrease) of the function. In your answer, indicate the length of the largest of these intervals.
7. Find the number of points where the tangent to the graph of the function is parallel to the straight line y = kx + b or coincides with it.
8. Find the abscissa of the point at which the tangent to the graph of the function is parallel to the abscissa axis or coincides with it.
There may be other questions, but they will not cause you any difficulties if you understand and (links are provided to articles that provide the information necessary for solving, I recommend repeating).
Basic information (briefly):
1. The derivative on increasing intervals has a positive sign.
If the derivative at a certain point from some interval has a positive value, then the graph of the function on this interval increases.
2. On the intervals of decreasing, the derivative has a negative sign.
If the derivative at a certain point from some interval has a negative value, then the graph of the function on this interval decreases.
3. The derivative at the point x is equal to the slope of the tangent drawn to the graph of the function at the same point.
4. At the points of extremum (maximum-minimum) of the function, the derivative is equal to zero. The tangent to the graph of the function at this point is parallel to the x-axis.
This needs to be clearly understood and remembered!!!
The graph of the derivative "confuses" many people. Some inadvertently take it for the graph of the function itself. Therefore, in such buildings, where you see that a graph is given, immediately focus your attention in the condition on what is given: a graph of a function or a graph of a derivative of a function?
If it is a graph of the derivative of a function, then treat it like a "reflection" of the function itself, which simply gives you information about this function.
Consider the task:
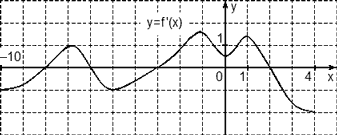
The figure shows a graph y=f'(X)- derivative function f(X), defined on the interval (–2;21).

We will answer the following questions:
1. At what point of the segment is the function f(X) takes on the largest value.
On a given segment, the derivative of the function is negative, which means that the function decreases on this segment (it decreases from the left boundary of the interval to the right). Thus, the maximum value of the function is reached on the left boundary of the segment, i.e., at point 7.
Answer: 7
2. At what point of the segment is the function f(X)
From this graph of the derivative, we can say the following. On a given segment, the derivative of the function is positive, which means that the function increases on this segment (it increases from the left border of the interval to the right one). Thus, the smallest value of the function is reached on the left border of the segment, that is, at the point x = 3.
Answer: 3
3. Find the number of maximum points of the function f(X)
The maximum points correspond to the points where the sign of the derivative changes from positive to negative. Consider where the sign changes in this way.
On the segment (3;6) the derivative is positive, on the segment (6;16) it is negative.
On the segment (16;18) the derivative is positive, on the segment (18;20) it is negative.
Thus, on a given segment, the function has two maximum points x = 6 and x = 18.
Answer: 2
4. Find the number of minimum points of the function f(X) belonging to the segment .
The minimum points correspond to the points where the sign of the derivative changes from negative to positive. We have a negative derivative on the interval (0; 3), and positive on the interval (3; 4).
Thus, on the segment, the function has only one minimum point x = 3.
*Be careful when writing the answer - the number of points is recorded, not the x value, such a mistake can be made due to inattention.
Answer: 1
5. Find the number of extremum points of the function f(X) belonging to the segment .
Please note that you need to find amount extremum points (these are both maximum and minimum points).
The extremum points correspond to the points where the sign of the derivative changes (from positive to negative or vice versa). On the graph given in the condition, these are the zeros of the function. The derivative vanishes at points 3, 6, 16, 18.
Thus, the function has 4 extremum points on the segment.
Answer: 4
6. Find the intervals of increasing function f(X)
Intervals of increase of this function f(X) correspond to the intervals on which its derivative is positive, that is, the intervals (3;6) and (16;18). Please note that the boundaries of the interval are not included in it (round brackets - boundaries are not included in the interval, square brackets are included). These intervals contain integer points 4, 5, 17. Their sum is: 4 + 5 + 17 = 26
Answer: 26
7. Find the intervals of decreasing function f(X) at a given interval. In your answer, indicate the sum of integer points included in these intervals.
Function Decreasing Intervals f(X) correspond to intervals on which the derivative of the function is negative. In this problem, these are the intervals (–2;3), (6;16), (18;21).
These intervals contain the following integer points: -1, 0, 1, 2, 7, 8, 9, 10, 11, 12, 13, 14, 15, 19, 20. Their sum is:
(–1) + 0 + 1 + 2 + 7 + 8 + 9 + 10 +
11 + 12 + 13 + 14 + 15 + 19 + 20 = 140
Answer: 140
*Pay attention in the condition: whether the boundaries are included in the interval or not. If the boundaries are included, then these boundaries must also be taken into account in the intervals considered in the solution process.
8. Find the intervals of increasing function f(X)
Function increase intervals f(X) correspond to the intervals on which the derivative of the function is positive. We have already indicated them: (3;6) and (16;18). The largest of them is the interval (3;6), its length is 3.
Answer: 3
9. Find the intervals of decreasing function f(X). In your answer, write the length of the largest of them.
Function Decreasing Intervals f(X) correspond to intervals on which the derivative of the function is negative. We have already indicated them, these are the intervals (–2; 3), (6; 16), (18; 21), their lengths are respectively equal to 5, 10, 3.
The length of the largest is 10.
Answer: 10
10. Find the number of points where the tangent to the graph of the function f(X) parallel to the line y \u003d 2x + 3 or coincides with it.
The value of the derivative at the point of contact is equal to the slope of the tangent. Since the tangent is parallel to the straight line y \u003d 2x + 3 or coincides with it, then their slopes are equal to 2. Therefore, it is necessary to find the number of points at which y (x 0) \u003d 2. Geometrically, this corresponds to the number of intersection points of the derivative graph with the straight line y = 2. There are 4 such points on this interval.
Answer: 4
11. Find the extremum point of the function f(X) belonging to the segment .
An extremum point of a function is a point at which its derivative is equal to zero, and in the vicinity of this point, the derivative changes sign (from positive to negative or vice versa). On the segment, the graph of the derivative crosses the x-axis, the derivative changes sign from negative to positive. Therefore, the point x = 3 is an extremum point.
Answer: 3
12. Find the abscissas of the points where the tangents to the graph y \u003d f (x) are parallel to the abscissa axis or coincide with it. In your answer, indicate the largest of them.
The tangent to the graph y \u003d f (x) can be parallel to the x-axis or coincide with it, only at points where the derivative is zero (these can be extremum points or stationary points, in the vicinity of which the derivative does not change its sign). This graph shows that the derivative is zero at points 3, 6, 16,18. The largest is 18.
The argument can be structured like this:
The value of the derivative at the point of contact is equal to the slope of the tangent. Since the tangent is parallel or coincident with the x-axis, its slope is 0 (indeed, the tangent of an angle of zero degrees is zero). Therefore, we are looking for a point at which the slope is equal to zero, which means that the derivative is equal to zero. The derivative is equal to zero at the point where its graph crosses the x-axis, and these are points 3, 6, 16,18.
Answer: 18
The figure shows a graph y=f'(X)- derivative function f(X) defined on the interval (–8;4). At what point of the segment [–7;–3] is the function f(X) takes the smallest value.

The figure shows a graph y=f'(X)- derivative function f(X), defined on the interval (–7;14). Find the number of maximum points of a function f(X) belonging to the segment [–6;9].

The figure shows a graph y=f'(X)- derivative function f(X) defined on the interval (–18;6). Find the number of minimum points of a function f(X) belonging to the interval [–13;1].

The figure shows a graph y=f'(X)- derivative function f(X), defined on the interval (–11; –11). Find the number of extremum points of a function f(X), belonging to the segment [–10; -ten].

The figure shows a graph y=f'(X)- derivative function f(X) defined on the interval (–7;4). Find the intervals of increasing function f(X). In your answer, indicate the sum of integer points included in these intervals.

The figure shows a graph y=f'(X)- derivative function f(X), defined on the interval (–5; 7). Find the intervals of decreasing function f(X). In your answer, indicate the sum of integer points included in these intervals.

The figure shows a graph y=f'(X)- derivative function f(X) defined on the interval (–11;3). Find the intervals of increasing function f(X). In your answer, write the length of the largest of them.

F The figure shows a graph
The condition of the problem is the same (which we considered). Find the sum of three numbers:
1. The sum of the squares of the extrema of the function f (x).
2. The difference of the squares of the sum of the maximum points and the sum of the minimum points of the function f (x).
3. The number of tangents to f (x) parallel to the straight line y \u003d -3x + 5.
The first one to give the correct answer will receive an incentive prize - 150 rubles. Write your answers in the comments. If this is your first comment on the blog, then it will not appear immediately, a little later (do not worry, the time of writing a comment is recorded).
Good luck to you!
Sincerely, Alexander Krutitsikh.
P.S: I would be grateful if you tell about the site in social networks.
There are new tasks. Let's take a look at their solution.
Job prototype B8 (#317543)
The figure shows a graph of the function y \u003d f (x) and points -2, -1, 1, 2 are marked. At which of these points is the value of the derivative the largest? Please indicate this point in your answer.
As we know it's called
limit of the ratio of function increment to argument increment when the argument increment goes to zero:
![]()
The derivative at a point shows function change rate at this point. The faster the function changes, that is, the greater the increment of the function, the greater the slope of the tangent. Since the task requires determining the point at which the value of the derivative is greatest, we exclude from consideration the points with abscissas -1 and 1 - at these points the function decreases, and the derivative is negative at them.
The function increases at points -2 and 2. However, it increases at them in different ways - at point -2, the graph of the function rises steeper than at point 2, and therefore, the increment of the function at this point, and hence the derivative, is greater.
Answer: -2
And a similar task:
Job prototype B8 (#317544)
The figure shows a function graph and points -2, -1, 1, 4 are marked. At which of these points is the value of the derivative the smallest? Please indicate this point in your answer.

The solution of this problem is similar to the solution of the previous one "exactly the opposite"
We are interested in the point at which the derivative takes the smallest value, that is, we are looking for the point at which the function decreases most rapidly - on the graph, this is the point at which the steepest "descent". This is the point with abscissa 4.
The derivative of a function is one of the most difficult topics in the school curriculum. Not every graduate will answer the question of what a derivative is.
This article simply and clearly explains what a derivative is and why it is needed.. We will not now strive for mathematical rigor of presentation. The most important thing is to understand the meaning.
Let's remember the definition:
The derivative is the rate of change of the function.
The figure shows graphs of three functions. Which one do you think grows the fastest?

The answer is obvious - the third. It has the highest rate of change, that is, the largest derivative.
Here is another example.
Kostya, Grisha and Matvey got jobs at the same time. Let's see how their income changed during the year:

You can see everything on the chart right away, right? Kostya's income has more than doubled in six months. And Grisha's income also increased, but just a little bit. And Matthew's income decreased to zero. The starting conditions are the same, but the rate of change of the function, i.e. derivative, - different. As for Matvey, the derivative of his income is generally negative.
Intuitively, we can easily estimate the rate of change of a function. But how do we do it?
What we are really looking at is how steeply the graph of the function goes up (or down). In other words, how fast y changes with x. Obviously, the same function at different points can have a different value of the derivative - that is, it can change faster or slower.
The derivative of a function is denoted by .
Let's show how to find using the graph.

A graph of some function is drawn. Take a point on it with an abscissa. Draw a tangent to the graph of the function at this point. We want to evaluate how steeply the graph of the function goes up. A handy value for this is tangent of the slope of the tangent.
The derivative of a function at a point is equal to the tangent of the slope of the tangent drawn to the graph of the function at that point.
Please note - as the angle of inclination of the tangent, we take the angle between the tangent and the positive direction of the axis.
Sometimes students ask what is the tangent to the graph of a function. This is a straight line that has the only common point with the graph in this section, moreover, as shown in our figure. It looks like a tangent to a circle.
Let's find . We remember that the tangent of an acute angle in a right triangle is equal to the ratio of the opposite leg to the adjacent one. From triangle:
We found the derivative using the graph without even knowing the formula of the function. Such tasks are often found in the exam in mathematics under the number.
There is another important correlation. Recall that the straight line is given by the equation
The quantity in this equation is called slope of a straight line. It is equal to the tangent of the angle of inclination of the straight line to the axis.
.
We get that
Let's remember this formula. It expresses the geometric meaning of the derivative.
The derivative of a function at a point is equal to the slope of the tangent drawn to the graph of the function at that point.
In other words, the derivative is equal to the tangent of the slope of the tangent.
We have already said that the same function can have different derivatives at different points. Let's see how the derivative is related to the behavior of the function.
Let's draw a graph of some function. Let this function increase in some areas, and decrease in others, and at different rates. And let this function have maximum and minimum points.

At a point, the function is increasing. The tangent to the graph, drawn at the point, forms an acute angle with the positive direction of the axis. So the derivative is positive at the point.
At the point, our function is decreasing. The tangent at this point forms an obtuse angle with the positive direction of the axis. Since the tangent of an obtuse angle is negative, the derivative at the point is negative.
Here's what happens:
If a function is increasing, its derivative is positive.
If it decreases, its derivative is negative.
And what will happen at the maximum and minimum points? We see that at (maximum point) and (minimum point) the tangent is horizontal. Therefore, the tangent of the slope of the tangent at these points is zero, and the derivative is also zero.
The point is the maximum point. At this point, the increase of the function is replaced by a decrease. Consequently, the sign of the derivative changes at the point from "plus" to "minus".
At the point - the minimum point - the derivative is also equal to zero, but its sign changes from "minus" to "plus".
Conclusion: with the help of the derivative, you can find out everything that interests us about the behavior of the function.
If the derivative is positive, then the function is increasing.
If the derivative is negative, then the function is decreasing.
At the maximum point, the derivative is zero and changes sign from plus to minus.
At the minimum point, the derivative is also zero and changes sign from minus to plus.
We write these findings in the form of a table:
| increases | maximum point | decreases | minimum point | increases | |
| + | 0 | - | 0 | + |
Let's make two small clarifications. You will need one of them when solving exam problems. Another - in the first year, with a more serious study of functions and derivatives.
A case is possible when the derivative of a function at some point is equal to zero, but the function has neither a maximum nor a minimum at this point. This so-called :

At a point, the tangent to the graph is horizontal and the derivative is zero. However, before the point the function increased - and after the point it continues to increase. The sign of the derivative does not change - it has remained positive as it was.
It also happens that at the point of maximum or minimum, the derivative does not exist. On the graph, this corresponds to a sharp break, when it is impossible to draw a tangent at a given point.

But how to find the derivative if the function is given not by a graph, but by a formula? In this case, it applies
Showing the relationship of the sign of the derivative with the nature of the monotonicity of the function.
Please be extremely careful in the following. Look, the schedule of WHAT is given to you! Function or its derivative
Given a graph of the derivative, then we are only interested in function signs and zeros. No "knolls" and "hollows" are of interest to us in principle!
Task 1.
The figure shows a graph of a function defined on an interval. Determine the number of integer points where the derivative of the function is negative.

Solution:
In the figure, the areas of decreasing function are highlighted in color:

4 integer values fall into these areas of decreasing function.

Task 2.
The figure shows a graph of a function defined on an interval. Find the number of points where the tangent to the graph of the function is parallel or coincident with the line.

Solution:
Since the tangent to the function graph is parallel (or coincides) with a straight line (or, which is the same, ) having slope, equal to zero, then the tangent has a slope .
This in turn means that the tangent is parallel to the axis, since the slope is the tangent of the angle of inclination of the tangent to the axis.
Therefore, we find extremum points on the graph (maximum and minimum points), - it is in them that the functions tangent to the graph will be parallel to the axis.

There are 4 such points.
Task 3.
The figure shows a graph of the derivative of a function defined on the interval . Find the number of points where the tangent to the graph of the function is parallel or coincident with the line.

Solution:
Since the tangent to the graph of the function is parallel (or coincides) with a straight line, which has a slope, then the tangent has a slope.
This in turn means that at the points of contact.
Therefore, we look at how many points on the graph have an ordinate equal to .

As you can see, there are four such points.
Task 4.
The figure shows a graph of a function defined on an interval. Find the number of points where the derivative of the function is 0.

Solution:
The derivative is zero at the extremum points. We have 4 of them:

Task 5.
The figure shows a function graph and eleven points on the x-axis:. At how many of these points is the derivative of the function negative?

Solution:
On intervals of decreasing function, its derivative takes negative values. And the function decreases at points. There are 4 such points.
Task 6.
The figure shows a graph of a function defined on an interval. Find the sum of the extremum points of the function .

Solution:
extremum points are the maximum points (-3, -1, 1) and the minimum points (-2, 0, 3).
The sum of extreme points: -3-1+1-2+0+3=-2.
Task 7.
The figure shows a graph of the derivative of a function defined on the interval . Find the intervals of increasing function . In your answer, indicate the sum of integer points included in these intervals.
Solution:
The figure highlights the intervals on which the derivative of the function is non-negative.
There are no integer points on the small interval of increase, on the interval of increase there are four integer values: , , and .

Their sum:
Task 8.
The figure shows a graph of the derivative of a function defined on the interval . Find the intervals of increasing function . In your answer, write the length of the largest of them.

Solution:
In the figure, all the intervals on which the derivative is positive are highlighted, which means that the function itself increases on these intervals.

The length of the largest of them is 6.
Task 9.
The figure shows a graph of the derivative of a function defined on the interval . At what point on the segment does it take the greatest value.

Solution:
We look at how the graph behaves on the segment, namely, we are interested in derivative sign only .

The sign of the derivative on is minus, since the graph on this segment is below the axis.