Covariance and correlation. An example of solving a problem on Wikimatic. Covariance and correlation matrices of a random vector Estimation of the statistical significance of the correlation coefficient
How often have you heard statements that say that one phenomenon is correlated with another?
“High growth is correlated with good education and happiness, according to experts from the Gallup polling service.”
“The price of oil is correlated with exchange rates.”
“Post-exercise muscle soreness does not correlate with muscle fiber hypertrophy.”
It seems that the concept of “correlation” has become widely used not only in science, but also in everyday life. Correlation reflects the degree of linear relationship between two random phenomena. So, when oil prices begin to fall, the dollar exchange rate against the ruble begins to rise.
From all of the above, we can conclude that when describing two-dimensional random variables, such well-known characteristics as mathematical expectation, dispersion, and standard deviation are sometimes insufficient. Therefore, two more very important characteristics are often used to describe them: covariance And correlation.
Covariance
Covariance$cov\left(X,\ Y\right)$ of random variables $X$ and $Y$ is the mathematical expectation of the product of random variables $X-M\left(X\right)$ and $Y-M\left(Y\right)$, that is:
$$cov\left(X,\ Y\right)=M\left(\left(X-M\left(X\right)\right)\left(Y-M\left(Y\right)\right)\right). $$
It can be convenient to calculate the covariance of random variables $X$ and $Y$ using the following formula:
$$cov\left(X,\ Y\right)=M\left(XY\right)-M\left(X\right)M\left(Y\right),$$
which can be obtained from the first formula using the properties of the mathematical expectation. Let's list the main covariance properties.
1 . The covariance of a random variable with itself is its variance.
$$cov\left(X,\ X\right)=D\left(X\right).$$
2 . Covariance is symmetrical.
$$cov\left(X,\ Y\right)=cov\left(Y,\ X\right).$$
3 . If the random variables $X$ and $Y$ are independent, then:
$$cov\left(X,\ Y\right)=0.$$
4 . The constant factor can be taken out of the covariance sign.
$$cov\left(cX,\ Y\right)=cov\left(X,\ cY\right)=c\cdot cov\left(X,\ Y\right).$$
5 . The covariance will not change if a constant value is added to one of the random variables (or two at once):
$$cov\left(X+c,\ Y\right)=cov\left(X,\ Y+c\right)=cov\left(X+x,\ Y+c\right)=cov\left( X,\Y\right).$$
6 . $cov\left(aX+b,\ cY+d\right)=ac\cdot cov\left(X,\ Y\right)$.
7 . $\left|cov\left(X,\ Y\right)\right|\le \sqrt(D\left(X\right)D\left(Y\right))$.
8 . $\left|cov\left(X,\ Y\right)\right|=\sqrt(D\left(X\right)D\left(Y\right))\Leftrightarrow Y=aX+b$.
9 . The variance of the sum (difference) of random variables is equal to the sum of their variances plus (minus) twice the covariance of these random variables:
$$D\left(X\pm Y\right)=D\left(X\right)+D\left(Y\right)\pm 2cov\left(X,\ Y\right).$$
Example 1 . A correlation table of a random vector $\left(X,\ Y\right)$ is given. Calculate the covariance $cov\left(X,\ Y\right)$.
$\begin(array)(|c|c|)
\hline
\hline
-2 & 0,1 & 0 & 0,2 \\
\hline
0 & 0.05 & p_(22) & 0 \\
\hline
1 & 0 & 0,2 & 0,05 \\
\hline
7 & 0,1 & 0 & 0,1 \\
\hline
\end(array)$
Events $\left(X=x_i,\ Y=y_j\right)$ form a complete group of events, therefore the sum of all probabilities $p_(ij)$ indicated in the table must be equal to 1. Then $0,1+0+0 ,2+0.05+p_(22)+0+0+0.2+0.05+0.1+0+0.1=1$, hence $p_(22)=0.2$.
$\begin(array)(|c|c|)
\hline
X\backslash Y & -6 & 0 & 3 \\
\hline
-2 & 0,1 & 0 & 0,2 \\
\hline
0 & 0,05 & 0,2 & 0 \\
\hline
1 & 0 & 0,2 & 0,05 \\
\hline
7 & 0,1 & 0 & 0,1 \\
\hline
\end(array)$
Using the formula $p_(i) =\sum _(j)p_(ij) $, we find the distribution series of the random variable $X$.
$\begin(array)(|c|c|)
\hline
X & -2 & 0 & 1 & 7 \\
\hline
p_i & 0.3 & 0.25 & 0.25 & 0.2 \\
\hline
\end(array)$
$$M\left(X\right)=\sum^n_(i=1)(x_ip_i)=-2\cdot 0.3+0\cdot 0.25+1\cdot 0.25+7\cdot 0 ,2=1.05.$$
$$D\left(X\right)=\sum^n_(i=1)(p_i(\left(x_i-M\left(X\right)\right))^2)=0.3\cdot ( \left(-2-1.05\right))^2+0.25\cdot (\left(0-1.05\right))^2+0.25\cdot (\left(1-1, 05\right))^2+$$
$$+\ 0.2\cdot (\left(7-1.05\right))^2=10.1475.$$
$$\sigma \left(X\right)=\sqrt(D\left(X\right))=\sqrt(10.1475)\approx 3.186.$$
Using the formula $q_(j) =\sum _(i)p_(ij) $, we find the distribution series of the random variable $Y$.
$\begin(array)(|c|c|)
\hline
Y & -6 & 0 & 3 \\
\hline
p_i & 0.25 & 0.4 & 0.35 \\
\hline
\end(array)$
$$M\left(Y\right)=\sum^n_(i=1)(y_ip_i)=-6\cdot 0.25+0\cdot 0.4+3\cdot 0.35=-0.45 .$$
$$D\left(Y\right)=\sum^n_(i=1)(p_i(\left(y_i-M\left(Y\right)\right))^2)=0.25\cdot ( \left(-6+0.45\right))^2+0.4\cdot (\left(0+0.45\right))^2+0.35\cdot (\left(3+0, 45\right))^2=11.9475.$$
$$\sigma \left(Y\right)=\sqrt(D\left(Y\right))=\sqrt(11.9475)\approx 3.457.$$
Since $P\left(X=-2,\ Y=-6\right)=0.1\ne 0.3\cdot 0.25$, then the random variables $X,\ Y$ are dependent.
Let us define the covariance $cov\ \left(X,\ Y\right)$ of random variables $X,\ Y$ by the formula $cov\left(X,\ Y\right)=M\left(XY\right)-M\ left(X\right)M\left(Y\right)$. The mathematical expectation of the product of random variables $X,\Y$ is equal to:
$$M\left(XY\right)=\sum_(i,\ j)(p_(ij)x_iy_j)=0.1\cdot \left(-2\right)\cdot \left(-6\right) +0.2\cdot \left(-2\right)\cdot 3+0.05\cdot 1\cdot 3+0.1\cdot 7\cdot \left(-6\right)+0.1\cdot 7\cdot 3=-1.95.$$
Then $cov\left(X,\ Y\right)=M\left(XY\right)-M\left(X\right)M\left(Y\right)=-1.95-1.05\cdot \left(-0.45\right)=-1.4775.$ If the random variables are independent, then their covariance is zero. In our case, $cov(X,Y)\ne 0$.
Correlation
Correlation coefficient random variables $X$ and $Y$ is called the number:
$$\rho \left(X,\ Y\right)=((cov\left(X,\ Y\right))\over (\sqrt(D\left(X\right)D\left(Y\right )))).$$
Let's list the main properties of the correlation coefficient.
1 . $\rho \left(X,\ X\right)=1$.
2 . $\rho \left(X,\ Y\right)=\rho \left(Y,\ X\right)$.
3 . $\rho \left(X,\ Y\right)=0$ for independent random variables $X$ and $Y$.
4 . $\rho \left(aX+b,\ cY+d\right)=(sgn \left(ac\right)\rho \left(X,\ Y\right)\ )$, where $(sgn \left( ac\right)\ )$ is the sign of the product $ac$.
5 . $\left|\rho \left(X,\ Y\right)\right|\le 1$.
6 . $\left|\rho \left(X,\ Y\right)\right|=1\Leftrightarrow Y=aX+b$.
It was previously said that the correlation coefficient $\rho \left(X,\ Y\right)$ reflects the degree of linear dependence between two random variables $X$ and $Y$.
When $\rho \left(X,\ Y\right)>0$ we can conclude that as the random variable $X$ increases, the random variable $Y$ tends to increase. This is called positive correlation. For example, a person’s height and weight are positively correlated.
When $\rho \left(X,\ Y\right)<0$ можно сделать вывод о том, что с ростом случайной величины $X$ случайная величина $Y$ имеет тенденцию к уменьшению. Это называется отрицательной корреляционной зависимостью. Например, температура и время сохранности продуктов питания связаны между собой отрицательной корреляционной зависимостью.
When $\rho \left(X,\ Y\right)=0$, the random variables $X$ and $Y$ are called uncorrelated. It is worth noting that the uncorrelated nature of random variables $X$ and $Y$ does not mean their statistical independence, it only means that there is no linear relationship between them.
Example 2 . Let us determine the correlation coefficient $\rho \left(X,\ Y\right)$ for the two-dimensional random variable $\left(X,\ Y\right)$ from Example 1.
The correlation coefficient of random variables $X,\Y$ is equal to $r_(XY) =(cov(X,Y)\over \sigma (X)\sigma (Y)) =(-1.4775\over 3.186\cdot 3.457) =-0.134.$ Since $r_(XY)<0$, то с ростом $X$ случайная величина $Y$ имеет тенденцию к уменьшению (отрицательная корреляционная зависимость).
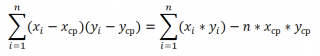
Mathematically covariance (English Covariance) is a measure of the linear dependence of two random variables. In portfolio theory, this indicator is used to determine the relationship between the return on a particular security and the return on a portfolio of securities. To calculate the covariance of returns, you need to use the following formula:
Where k i– profitability of the security in the i-th period;
Expected (average) return of a security;
p i– portfolio return in the i-th period;
Expected (average) portfolio return;
n– number of observations.
It should be noted that ( n-1) if the covariance is calculated based on a sample from a population of observations. If the entire population is taken into account in the calculations, then the denominator is substituted n.
Example. The table shows the dynamics of the profitability of shares of Company A and Company B, as well as the dynamics of the profitability of the securities portfolio.

To use the above formula to calculate the covariance of the return of each stock with the portfolio, you need to calculate the average return, which will be:
- for shares of Company A 4.986%;
- for shares of Company B 5.031%;
- for the portfolio 3.201%.

Thus, the covariance of Company A's shares with the portfolio will be -0.313, and Company B's shares will be 0.242.
Cov(kA,kp) = ((5,93-4,986)(2,27-3,201) + (5,85-4,986)(2,39-3,201) + (5,21-4,986)(3,47-3,201) + (5,37-4,986)(3,21-3,201) + (4,99-4,986)(2,95-3,201) + (4,87-4,986)(2,97-3,201) + (4,70-4,986)(3,32-3,201) + (4,75-4,986)(3,65-3,201) + (4,33-4,986)(3,97-3,201) + (3,86-4,986)(3,81-3,201))/(10-1) = -0,313
Cov (k B, k p) = ((4,25-5,031)(2,27-3,201) + (4,47-5,031)(2,39-3,201) + (4,68-5,031)(3,47-3,201) + (4,71-5,031)(3,21-3,201) + (4,77-5,031)(2,95-3,201) + (5,25-5,031)(2,97-3,201) + (5,45-5,031)(3,32-3,201) + (5,33-5,031)(3,65-3,201) + (5,55-5,031)(3,97-3,201) + (5,85-5,031)(3,81-3,201))/(10-1) = 0,242
Similar calculations can be made in Microsoft Excel using the “COVARIANCE.B” function for a sample from a population or the “COVARIATION.G” function for the entire population.
Interpreting covariance
The value of the covariance coefficient can be either negative or positive. Its negative value indicates that the security's return and the portfolio's return are moving in different directions. In other words, if the security's yield rises, the portfolio's yield will fall, and vice versa. A positive value indicates that the returns of the security and the portfolio are moving in the same direction.
A low value (close to 0) of the covariance coefficient is observed when fluctuations in the security's return and portfolio return are random in nature.
Let's calculate the correlation coefficient and covariance for different types of relationships between random variables.
Correlation coefficient(correlation criterion Pearson, English Pearson Product Moment correlation coefficient) determines the degree linear relationships between random variables.
As follows from the definition, to calculate correlation coefficient it is required to know the distribution of random variables X and Y. If the distributions are unknown, then to estimate correlation coefficient used sample correlation coefficientr ( it is also designated as Rxy or r xy) :

where S x – standard deviation sample of a random variable x, calculated by the formula:

As can be seen from the calculation formula correlations, the denominator (the product of the standard deviations) simply normalizes the numerator such that correlation turns out to be a dimensionless number from -1 to 1. Correlation And covariance provide the same information (if known standard deviations), But correlation more convenient to use, because it is a dimensionless quantity.
Calculate correlation coefficient And sample covariance in MS EXCEL is not difficult, since there are special functions CORREL() and KOVAR() for this purpose. It is much more difficult to figure out how to interpret the obtained values; most of the article is devoted to this.
Theoretical retreat
Let us remind you that correlation connection call a statistical relationship consisting in the fact that different values of one variable correspond to different average values are different (with a change in the value of X average value Y changes in a regular way). It is assumed that both variables X and Y are random values and have a certain random scatter relative to them average value.
Note. If only one variable, for example, Y, has a random nature, and the values of the other are deterministic (set by the researcher), then we can only talk about regression.
Thus, for example, when studying the dependence of the average annual temperature, one cannot talk about correlations temperature and year of observation and, accordingly, apply indicators correlations with their corresponding interpretation.
Correlation between variables can arise in several ways:
- The presence of a causal relationship between variables. For example, the amount of investment in scientific research (variable X) and the number of patents received (Y). The first variable appears as independent variable (factor), second - dependent variable (outcome). It must be remembered that the dependence of quantities determines the presence of a correlation between them, but not vice versa.
- The presence of conjugation (common cause). For example, as the organization grows, the wage fund (payroll) and the cost of renting premises increase. Obviously, it is wrong to assume that the rental of premises depends on the payroll. Both of these variables depend linearly on the number of personnel in many cases.
- Mutual influence of variables (when one changes, the second variable changes, and vice versa). With this approach, two formulations of the problem are allowed; Any variable can act both as an independent variable and as a dependent variable.
Thus, correlation indicator shows how strong linear relationship between two factors (if there is one), and regression allows you to predict one factor based on the other.
Correlation, like any other statistical indicator, can be useful when used correctly, but it also has limitations in its use. If it shows a clearly defined linear relationship or a complete lack of relationship, then correlation will reflect this wonderfully. But, if the data shows a non-linear relationship (for example, quadratic), the presence of separate groups of values or outliers, then the calculated value correlation coefficient may be misleading (see example file).
Correlation close to 1 or -1 (i.e. close in absolute value to 1) shows a strong linear relationship between the variables, a value close to 0 shows no relationship. Positive correlation means that with an increase in one indicator, the other on average increases, and with a negative indicator, it decreases.
To calculate the correlation coefficient, it is required that the compared variables satisfy the following conditions:
- the number of variables must be equal to two;
- variables must be quantitative (eg frequency, weight, price). The calculated average of these variables has a clear meaning: average price or average patient weight. Unlike quantitative variables, qualitative (nominal) variables take values only from a finite set of categories (for example, gender or blood type). These values are conventionally associated with numerical values (for example, female gender is 1, and male gender is 2). It is clear that in this case the calculation average value, which is required to find correlations, is incorrect, and therefore the calculation itself is incorrect correlations;
- variables must be random variables and have .
Two-dimensional data can have different structures. Some of them require certain approaches to work with:
- For data with non-linear relationship correlation must be used with caution. For some problems, it may be useful to transform one or both variables to produce a linear relationship (this requires making an assumption about the type of nonlinear relationship in order to suggest the type of transformation needed).
- By using scatter plots Some data may exhibit unequal variation (scatter). The problem with uneven variation is that locations with high variation not only provide the least accurate information, but also have the greatest impact when calculating statistics. This problem is also often solved by transforming the data, such as using logarithms.
- Some data can be observed to be divided into groups (clustering), which may indicate the need to divide the population into parts.
- An outlier (a sharply deviating value) can distort the calculated value of the correlation coefficient. An outlier may be due to chance, an error in data collection, or may actually reflect some feature of the relationship. Since the outlier deviates greatly from the average value, it makes a large contribution to the calculation of the indicator. Statistical indicators are often calculated with and without taking into account outliers.
Using MS EXCEL to calculate correlation
Let's take 2 variables as an example X And Y and correspondingly, sample consisting of several pairs of values (X i; Y i). For clarity, let's build .

Note: For more information about constructing diagrams, see the article. In the example file for building scatter plots used because Here we have deviated from the requirement that variable X be random (this simplifies the generation of various types of relationships: constructing trends and a given spread). For real data, you must use a Scatter chart (see below).
Calculations correlations Let us draw relationships between variables for various cases: linear, quadratic and at lack of communication.
Note: In the example file, you can set the parameters of the linear trend (slope, Y-intercept) and the degree of scatter relative to this trend line. You can also adjust the quadratic parameters.
In the example file for building scatter plots if there is no dependence of variables, a scatter diagram is used. In this case, the points on the diagram are arranged in the form of a cloud.

Note: Please note that by changing the scale of the diagram along the vertical or horizontal axis, the cloud of points can be given the appearance of a vertical or horizontal line. It is clear that the variables will remain independent.
As mentioned above, to calculate correlation coefficient in MS EXCEL there is a CORREL() function. You can also use the similar function PEARSON(), which returns the same result.
To make sure that the calculations correlations are produced by the CORREL() function using the above formulas; the example file shows the calculation correlations using more detailed formulas:
=COVARIANCE.G(B28:B88;D28:D88)/STDEV.G(B28:B88)/STDEV.G(D28:D88)
=COVARIANCE.B(B28:B88;D28:D88)/STDEV.B(B28:B88)/STDEV.B(D28:D88)
Note: Square correlation coefficient r is equal to coefficient of determination R2, which is calculated when constructing a regression line using the QPIRSON() function. The value of R2 can also be output to scatter diagram by building a linear trend using the standard MS EXCEL functionality (select the chart, select the tab Layout, then in the group Analysis click the button Trend line and select Linear approximation). For more information on constructing a trend line, see, for example, .

Using MS EXCEL to Calculate Covariance
Covariance is close in meaning to (also a measure of dispersion) with the difference that it is defined for 2 variables, and dispersion- for one. Therefore, cov(x;x)=VAR(x).

To calculate covariance in MS EXCEL (starting from version 2010), the functions COVARIATION.Г() and COVARIATION.В() are used. In the first case, the formula for calculating is similar to the above (end .G stands for Population), in the second, instead of the multiplier 1/n, 1/(n-1) is used, i.e. ending .IN stands for Sample.
Note: The COVAR() function, which is present in MS EXCEL in earlier versions, is similar to the COVARIATION.G() function.
Note: The CORREL() and COVAR() functions are presented in the English version as CORREL and COVAR. The functions COVARIANCE.G() and COVARIANCE.B() as COVARIANCE.P and COVARIANCE.S.
Additional formulas for calculation covariances:
=SUMPRODUCT(B28:B88-AVERAGE(B28:B88);(D28:D88-AVERAGE(D28:D88)))/COUNT(D28:D88)
=SUMPRODUCT(B28:B88-AVERAGE(B28:B88),(D28:D88))/COUNT(D28:D88)
=SUMPRODUCT(B28:B88;D28:D88)/COUNT(D28:D88)-AVERAGE(B28:B88)*AVERAGE(D28:D88)
These formulas use the property covariances:
If the variables x And y independent, then their covariance is 0. If the variables are not independent, then the variance of their sum is equal to:
VAR(x+y)= VAR(x)+ VAR(y)+2COV(x;y)
A dispersion their difference is equal
VAR(x-y)= VAR(x)+ VAR(y)-2COV(x;y)
Estimation of statistical significance of the correlation coefficient
In order to test the hypothesis, we must know the distribution of the random variable, i.e. correlation coefficient r. Usually, the hypothesis is tested not for r, but for the random variable t r:

which has n-2 degrees of freedom.
If the calculated value of the random variable |t r | is greater than the critical value t α,n-2 (α-specified), then the null hypothesis is rejected (the relationship between the values is statistically significant).

Analysis package add-on
B to calculate covariance and correlation there are instruments of the same name analysis.

After calling the tool, a dialog box appears containing the following fields:

- Input interval: you need to enter a link to a range with source data for 2 variables
- Grouping: As a rule, the source data is entered in 2 columns
- Labels in the first line: if the checkbox is checked, then Input interval must contain column headers. It is recommended to check the box so that the result of the Add-in contains informative columns
- Output interval: the range of cells where the calculation results will be placed. It is enough to indicate the upper left cell of this range.
The add-in returns the calculated correlation and covariance values (for covariance, the variances of both random variables are also calculated).

In the case of a multidimensional random variable (random vector), the characteristic of the scatter of its components and the relationships between them is the covariance matrix.
Covariance matrix is defined as the mathematical expectation of the product of a centered random vector by the same but transposed vector:
Where 
The covariance matrix has the form

where the variances of the random vector coordinates are located along the diagonal o n =D Xi, o 22 =D X2, o kk = D Xk, and the remaining elements represent the covariances between the coordinates
°12 = M"x i x 2 j a 1* = M-jc,** >
The covariance matrix is a symmetric matrix, i.e. ![]()
For example, consider the covariance matrix of a two-dimensional vector

The covariance matrix is obtained similarly for any /^-dimensional vector.
The coordinate dispersions can be represented as
where is Gi,C2,...,0? - standard deviations of random vector coordinates.
As is known, the correlation coefficient is the ratio of covariance to the product of standard deviations:

After normalization by the last ratio of the terms of the covariance matrix, the correlation matrix is obtained

which is symmetric and non-negative definite.
A multidimensional analogue of the dispersion of a random variable is generalized dispersion, which is understood as the value of the determinant of the covariance matrix
![]()
Another general characteristic of the degree of dispersion of a multivariate random variable is the trace of the covariance matrix
where Скк are the diagonal elements of the covariance matrix.
Often in multivariate statistical analysis, the normal distribution is used.
A generalization of the normal probability density to the case of a ^-dimensional random vector is the function
where q = (pj, q 2 , M^) m - column vector of mathematical expectations;
|X| - determinant of the covariance matrix X;
1 - inverse covariance matrix.
Matrix X -1, inverse of matrix X of dimension puh p, can be obtained in various ways. One of them is the Jordan-Gauss method. In this case, the matrix equation is compiled
Where X- column vector of variables, the number of which is equal to i; b- i is a dimensional column vector of right-hand sides.
Let us multiply equation (6.21) on the left by the inverse matrix XG 1:
![]()
Since the product of the inverse matrix and the given one gives the identity matrix E, That
![]()
If instead b take the unit vector

then the product X -1 -e x gives the first column of the inverse matrix. If we take the second unit vector

then the product E 1 e 2 gives the first column of the inverse matrix, etc. Thus, sequentially solving the equations
![]()
using the Jordan-Gauss method, we obtain all columns of the inverse matrix.
Another method for obtaining the matrix inverse to the matrix E involves calculating algebraic complements A tJ .= (/= 1, 2,..., P; j = 1, 2, ..., P) to the elements of a given matrix E, substituting them instead of the elements of matrix E and transporting such a matrix:

The inverse matrix is obtained after dividing the elements IN to the determinant of matrix E:
An important feature of obtaining the inverse matrix in this case is that the covariance matrix E is weakly conditioned. This leads to the fact that quite serious errors can occur when inverting such matrices. All this requires ensuring the necessary accuracy of the computational process or the use of special methods when calculating such matrices.
Example. Write a probability density expression for a normally distributed two-dimensional random variable (X v X 2)
provided that the mathematical expectations, variances and covariances of these quantities have the following values:
Solution. The inverse covariance matrix for matrix (6.19) can be obtained using the following matrix inverse expression for matrix X:

where A is the determinant of the matrix X.
A and, L 12, A 21, A 22- algebraic additions to the corresponding elements of the matrix X.
Then for the matrix ]r- ! we get the expression

Since a 12 = 01О2Р and °2i =a 2 a iP> and a i2 a 2i = cyfst|r, then,

Let's find the work


The probability density function will be written in the form

Substituting the initial data, we obtain the following expression for the probability density function

Let's consider the technique of calculating the covariance and correlation of security returns using an example.
The yield on paper X over five years was 20%, 25%, 22%, 28%, 24%, respectively. Yield on paper F: 24%, 28%, 25%, 27%, 23%. Determine the covariance of security returns.
Let us present the solution to the problem in two ways.
a) We print in chronological order in cells with Al no A5 the yield values of paper X, and in cells B1 to B5 - the yield of paper F. We get the solution in cell C1, so we hover the cursor over it and click the mouse. We print the formula in cell C1:
and press the Enter key. In cell C1 the solution to the problem appeared - the number 3.08, i.e. sample covariance for our example.
b) Covariance can be calculated using the Function Wizard program. To do this, move the cursor over the A icon on the toolbar and click the mouse. The "Function Wizard" window appears. In the left field (“Category”), move the cursor to the “Statistical” line and click the mouse. The line was highlighted in blue, and a list of statistical functions appeared in the right field of the window (“Function”). Place the cursor on the line "KOVAR" and click the left mouse button. The line is highlighted in blue. Place the cursor over the OK button and click. The "KOVAR" window appears. There are two lines in the window called "Array 1" and "Array 2". In the first line we enter the cell numbers from A1 to A5. To do this, move the cursor to sign 3, located on the right side of the first line and click the mouse. The "KOVAR" window has become the first line field. Place the cursor over cell A1, press the left mouse button and, holding it down, move the cursor down to cell A5 and release the key. The entry A1:A5 appears in the line field. Move the cursor over the sign again??? and click the mouse. The expanded "KOVAR" window appears. We enter the cell numbers with Bl no B5 in the second line. To do this, move the cursor to the 5J sign in the second line and click the mouse. Place the cursor over cell B1, press the left mouse button and, holding it down, move the cursor down to cell B5 and release the key. The entry B1:B5 appears in the line field. Move the cursor to button 3| and click the mouse. The expanded "KOVAR" window appears. Place the cursor over the OK button and click. The number 3.08 appeared in cell C1.
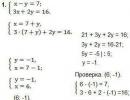
Determine the correlation coefficient of security returns for the conditions of example 1. Solution. Let us present the solution to the problem in two ways.
a) We print in chronological order in cells with Al no A5 the yield values of paper X, and in cells B1 to B5 - the yield of paper F. We get the solution in cell C1, so we hover the cursor over it and click the mouse. We print the formula in cell C1:
![]()
and press the Enter key. The solution to the problem appeared in cell C1 - the number 0.612114.
b) Correlation can be calculated using the Function Wizard program. To do this, select the “l” icon on the toolbar with the cursor and click the mouse. The "Function Wizard" window appears. In the left field (“Category”), select the line “Statistical” with the cursor and click the mouse. A list of statistical functions appears in the right field of the window (“Function”). Select the line “CORREL” with the cursor and click the mouse. The line is highlighted in blue. Place the cursor over the OK button and click. The CORREL window appears. There are two lines in the window called "Array 1" and "Array 2". In the first line we enter the cell numbers with Al no A5. To do this, move the cursor over the ZR sign to the right of the first line and click the mouse. The CORREL window has become the first line field. Place the cursor over cell A1, press the left mouse button and, holding it down, move the cursor down to cell A5 and release the key. The entry A1:A5 appears in the line field. Move the cursor over the sign Ш again and click the mouse. The expanded CORREL window appears. We enter the cell numbers with Bl no B5 in the second line. To do this, move the cursor to the Ш sign in the second line and click the mouse. Place the cursor over cell B1, press the left mouse button and, holding it down, move the cursor down to cell B5 and release the key. The entry B1:B5 appears in the line field. Move the cursor over the button and click we sew. The expanded CORREL window appears. Place the cursor over the OK button and click. The number 0.612114 appears in cell C1.
In Examples 1 and 2, we calculated the covariance and correlation of the returns of two securities in the portfolio. If the portfolio includes a larger number of securities, then the covariances and correlations of their returns can be calculated in pairs using the method described above, but this is a labor-intensive solution to the problem. Excel has a special “Data Analysis” package that allows you to quickly solve this problem for a large number of papers. Let's consider calculating covariance and correlations using it.
Do you know that: Forex broker "NPBFX" brings absolutely all of its clients' transactions to liquidity providers (to the interbank market), working on STP/NDD technologies(Straight-through processing - straight-through transaction processing / Non Dealing Desk).


The "Analysis Pack" may not be installed. Then you need to install it. To do this, move the cursor over the “Service” menu and click the left mouse button. A drop-down menu appears. Using the cursor, select the “Add-Ins” command in it and click the left mouse button. The "Add-Ins" dialog box appears. Place the cursor over the window to the left of the “Analysis package” line and click the left mouse button. A check mark appears in the window. Place the cursor over the OK button and click. "Analysis package" is installed. Let's look at the definition of covariance and correlations for several securities using an example.
Example 3: Covariance Calculation
There is a sample of data on the yields of securities B, C and D for ten periods. We print the yield values for paper B in cells B1 to B10, paper C from C1 to SY, and paper D from D1 to D10, as shown in Fig. 1.8. Place the cursor on the "Service" menu and click the left mouse button. A drop-down menu appears. Place the cursor on the line “Data Analysis” and click the left mouse button. The "Data Analysis" window appears. Place the cursor on the line "Covariance" and click the left mouse button. The line is highlighted in blue. Place the cursor over the OK button and click. The Covariance window appears." (see Fig. 1.10).


Place the cursor on sign 3 to the right of the “Input interval” line field and click the mouse. The Covariance window has collapsed into a row field. Place the cursor over cell B1, press the left mouse button and, holding it down, drag to cell D10. The entry $B$1:$D$10 appeared in the line. Move the cursor over the sign again and click the mouse. The expanded “Covariance” window appears. We group the data by columns. Therefore, if in the round window there is no dot to the left of the inscription “by columns”, then we move the cursor over it and click the left mouse button. A dot will appear in the window. Below is the line “Output interval”. There should be a dot in the round window to the left of the inscription. If it is not there, then move the cursor over this line and click the left mouse button. A dot will appear in the window. Place the cursor on sign 3 to the right of the “Output interval” line field and click the mouse. The Covariance window has become a line field. Let's take cell A12 as the beginning of the output interval. Therefore, we move the cursor over it and press the left mouse button. The entry $A$12 appears in the line field. Move the cursor to sign 3 again and click the mouse. The Covariance window has expanded. Place the cursor over the OK button and click. The solution to the problem appeared on the sheet as shown in Fig. 1.11. Block B13 to D15 presents the covariance matrix. Along its diagonal, i.e. in cells B13, C14 and B15 the variances of securities B, C and D are located, respectively, in the remaining cells - the covariance of the yields of the securities: in cell B14 there is the covariance of the yields of securities B and C, in B15 - of securities B and D, in C15 - of securities C and D .

Example 4: Calculation of correlations
There is a sample of data on the yields of three securities - B, C and D - for ten periods. As in task 3, we print the yield values for paper B in cells B1 to B10, paper C from C1 to C10, and paper D from D1 to D10 (Fig. 1.9). Place the cursor on the "Service" menu and click the left mouse button. A drop-down menu appears. Place the cursor on the line “Data Analysis” and click the left mouse button. The "Data Analysis" window appears. Place the cursor on the line “Correlation” and click the left mouse button. The line is highlighted in blue. Place the cursor over the OK button and click. The correlation window appears (its structure is similar to the “covariance” window). Place the cursor on sign 3 to the right of the “Input interval” line field and click the mouse. The Correlation window has collapsed into a line field. Place the cursor over cell B1, press the left mouse button and, holding it down, move the cursor to cell D10. The entry $B$1:$D$10 appeared in the line. Move the cursor over the sign again and click the mouse. The expanded "Correlation" window appears. We group the data by columns. Therefore, if in the round window there is no dot to the left of the inscription “by columns”, then we move the cursor over it and click the left mouse button. A dot will appear in the window. Below is the line “Output interval”. There should be a dot in the round window to the left of the inscription. If it is not there, then move the cursor over this line and click the left mouse button. A dot will appear in the window. Place the cursor on sign 3 to the right of the “Output interval” line field and click the mouse. The Correlation window has become a line field. Let's take cell A12 as the beginning of the output interval. Therefore, we move the cursor over it and press the left mouse button. The entry $A$12 appears in the line field. Move the cursor to sign 3 again and click the mouse. The "Correlation" window has expanded. Place the cursor over the OK button and click. The solution to the problem appeared on the sheet as shown in Figure 1.12. Block B13 to D15 presents the correlation matrix. Along its diagonal, i.e. in cells B13, C14 and D15 there are units, in the remaining cells there are correlations of security yields: in cell B14 there is a correlation of the yields of securities B and C, in B15 - securities B and D, in C15 - securities C and D.

Content